Check Out LinkedIn’s New Page Analytics!
Editor’s note: If you’re not familiar with Social Media, some of these words might sound like Mumbo Jumbo; so I’ve included definitions for you at the bottom of this article.
LinkedIn’s new Company Page Analytics has made it very easy to understand what content is resonating with your followers. Savvy Real Estate agents (like you) can take this knowledge to engage with more followers – which generates more lead opportunities!
The coolest features about LinkedIn’s Analytics are:
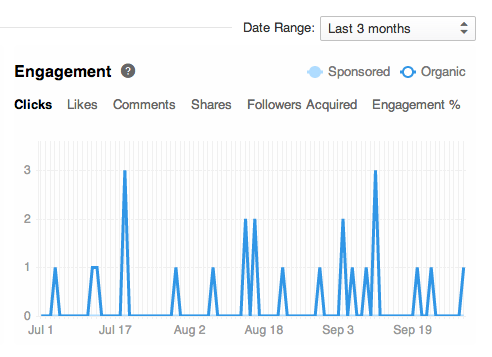
- Company Updates. LinkedIn collects the data on each of your posts (updates) made through your company page and show you statistics on interactions, clicks, new followers, and engagements.
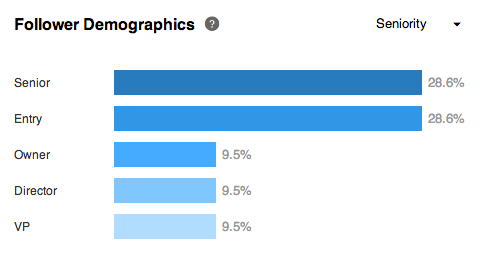
- Follower Demographics. Now it’s easier than ever to know who’s following your company with LinkedIn’s 5 types of demographic data: seniority, industry, job function, company size, and more!
- Engagement. The numbers in your engagement are calculated by adding your interactions, clicks, new followers, and impressions.
- How You Compare. See how your statistics compare with other LinkedIn members in your industry, then check out the competition’s posts and see how to improve your own.
 Impressions = The number of times each update was shown to LinkedIn members.
Interactions = the number of comments, likes, and shares.
Clicks = The number of clicks on your content, the company name, or the logo.
New followers/Followers Acquired = How many followers you gained by sponsoring each update.
Do yourself a favour and look at the numbers listed beside each post. Which ones have a higher number of impressions and clicks? Look at commonalities between each “popular” update. Are they both Home Staging Tips? Are they both videos? Once you analyze what topics your followers engage with, post more of it!
In the end, the best way for you to truly understand LinkedIn Analytics and improve your posts are by exploring, taking initiative, and failing. That’s right, you have to fail in order to succeed.
Happy posting!
Sign-up For FREE Updates


